The volume on the Japanese Yen futures contract (JY) last week was the highest weekly volume in over six years. The last time the market had volume anywhere near this size, a significant rally that lasted over five years resulted. This could be a sign of major institutional involvement, with major hedge funds making moves in this market. Be patient and wait for a bullish setup to take advantage of — this could be a major move.
Lets look at the charts:
Chart 1 (daily)

From Chart 1, we see very high stopping volume (blue highlights) and evidence that the market is now being accumulated (green volume bars.) What should happen next? Expect a test to the downside narrow range down bar with high volume and the close in the top 50 percent of the bar’s range.
Chart 2 (weekly)

From this weekly chart, we see buying volume is coming in (see the cyan arrow). The price bar is moving up and if there is a close above the weekly Hawkeye stop (the red cross), a new uptrend will develop.
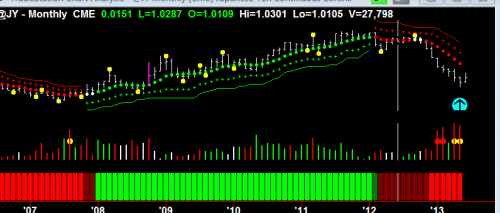
Chart 3 (monthly)

The monthly chart shows high selling volume, but we now have a potential Hawkeye pivot (at the cyan arrow). If an isolated low or pivot does form, we expect it will push the market to the upside for a minimum of 3, 5, or 7 bars.
The Hawkeye Perspective
In conclusion, all three timeframes are manifesting stopping volume from the downtrend that has been in place on the monthly charts since the 29th of February 2012. This market is highly oversold and the Hawkeye Volume algorithm will lead the way, showing the commencement of a new uptrend. However, if the low that occurred on the 13th of May 2013 at 06:52 is taken out, it will revert back into downtrend.
Now YOU can get this Hawkeye edge at the next Hawkeye Seminar in Santa Ana, CA, 21-23 September 2013.


